
Quantitative Techniques for Business Decisions: Making Data-Driven Choices
In today’s fast-paced and highly competitive business world, making sound decisions is crucial for success. While intuition and experience play a significant role in decision-making, relying solely on subjective judgment can be risky. This is where quantitative techniques come into play.
Quantitative techniques refer to the use of mathematical and statistical methods to analyze data and make informed decisions. These techniques provide businesses with a systematic approach to problem-solving, allowing them to base their choices on objective evidence rather than guesswork. Let’s explore some of the key quantitative techniques used in business decision-making.
- Data Analysis: The foundation of quantitative techniques lies in data analysis. By collecting and analyzing relevant data, businesses can gain valuable insights into market trends, customer behavior, and operational performance. Techniques such as regression analysis, correlation analysis, and time series analysis help identify patterns, relationships, and potential future outcomes.
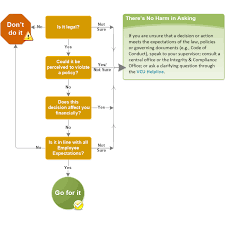
- Decision Trees: Decision trees are graphical representations that help visualize decision-making processes. They display different alternatives or courses of action along with their associated probabilities and outcomes. Decision trees enable businesses to evaluate the potential risks and rewards of different options, making it easier to choose the most favorable path.
- Linear Programming: Linear programming is a widely used optimization technique that helps businesses maximize profits or minimize costs within given constraints. It involves formulating a mathematical model with linear relationships between variables and solving it using algorithms. Linear programming is commonly applied in production planning, resource allocation, inventory management, and supply chain optimization.
- Forecasting: Forecasting involves predicting future events or trends based on historical data patterns. Time series analysis, moving averages, exponential smoothing, and regression analysis are among the various quantitative techniques used for forecasting purposes. Accurate forecasts enable businesses to anticipate demand fluctuations, plan production levels efficiently, manage inventory effectively, and make informed financial decisions.
- Simulation: Simulation involves creating models that replicate real-world scenarios to analyze the potential outcomes of different decisions. Monte Carlo simulation, for example, generates multiple iterations of a model using random variables to assess the range of possible outcomes. Simulation helps businesses evaluate the impact of various factors on their decision-making process and identify potential risks and opportunities.
- Statistical Decision Theory: Statistical decision theory combines statistical analysis with decision-making theory to help businesses make optimal choices under uncertainty. It involves assigning probabilities to different outcomes, calculating expected values, and assessing the risks associated with each decision alternative. By quantifying uncertainties and considering their impact on outcomes, businesses can make more informed decisions.
In conclusion, quantitative techniques provide businesses with powerful tools to enhance decision-making processes. By leveraging data analysis, optimization methods, forecasting techniques, simulation models, and statistical decision theory, businesses can reduce uncertainty and make data-driven choices that lead to improved performance and competitive advantage.
It’s important to note that while quantitative techniques are valuable tools, they should be used in conjunction with qualitative analysis and expert judgment. The human element remains essential in interpreting results and considering contextual factors that may not be captured by quantitative models alone. Ultimately, a balanced approach that combines both quantitative techniques and human insight is key to effective business decision-making in today’s dynamic environment.
7 Tips for Effective Quantitative Techniques in Business Decision-Making
- Develop a clear understanding of the problem you are trying to solve. Identify the key variables involved in the decision-making process and their associated data points.
- Utilize statistical analysis to identify correlations between different variables and make informed predictions based on those correlations.
- Utilize quantitative techniques such as regression analysis, Monte Carlo simulation, and optimization algorithms to identify optimal solutions for complex problems with multiple variables.
- Leverage predictive analytics tools such as machine learning algorithms to identify patterns in historical data and create forecasts that can inform future decisions.
- Use decision trees or other decision support systems to evaluate different scenarios and outcomes when making decisions about investments or other business operations with high risk/reward ratios.
- Analyze large datasets using big data technologies like Hadoop or Spark to uncover hidden insights that can help inform strategic decisions about products, pricing, customer segmentation, etc..
- Utilize data visualization tools such as Tableau or Power BI to present information clearly and concisely so that stakeholders can easily understand it and make informed decisions quickly
Develop a clear understanding of the problem you are trying to solve. Identify the key variables involved in the decision-making process and their associated data points.
Develop a Clear Understanding: The First Step in Quantitative Decision-Making
When it comes to making effective business decisions using quantitative techniques, the first and most crucial step is to develop a clear understanding of the problem at hand. This involves identifying the key variables involved in the decision-making process and gathering their associated data points.
Why is this step so important? Well, without a clear understanding of the problem, it becomes difficult to apply quantitative techniques accurately and derive meaningful insights. By taking the time to define the problem and identify its key variables, businesses can ensure that their decision-making process is focused and targeted.
To begin, start by clearly defining the problem you are trying to solve. What specific issue or challenge are you facing? By articulating the problem in precise terms, you can narrow down your focus and avoid wasting resources on irrelevant factors.
Next, identify the key variables that play a role in your decision-making process. These variables can be anything that has an impact on the outcome you are trying to achieve. For example, if you are trying to optimize production levels, variables such as raw material costs, labor hours, machine capacity, and demand fluctuations may be relevant.
Once you have identified these key variables, gather relevant data points associated with each one. This could involve collecting historical data from past operations or conducting surveys or market research to obtain current information. The quality and accuracy of your data will significantly impact the reliability of your quantitative analysis.
By developing a clear understanding of the problem and identifying key variables with their associated data points, businesses lay a solid foundation for applying quantitative techniques effectively. This step allows for more accurate modeling, analysis, and interpretation of results.
Moreover, having a well-defined problem statement helps ensure that all stakeholders involved in the decision-making process are on the same page. It facilitates effective communication and collaboration among team members who may have different perspectives or expertise.
Remember that developing a clear understanding is an iterative process. As you gather more data and gain insights through quantitative analysis, your understanding of the problem may evolve. Stay open to revisiting and refining your problem statement and variable selection as you progress.
In conclusion, developing a clear understanding of the problem you are trying to solve is the critical first step in using quantitative techniques for business decisions. By defining the problem, identifying key variables, and gathering relevant data points, businesses can lay a solid foundation for accurate analysis and informed decision-making. So take the time to clarify your objectives and gather the necessary information before diving into quantitative analysis—it will undoubtedly pay off in the long run.
Utilize statistical analysis to identify correlations between different variables and make informed predictions based on those correlations.
Utilize Statistical Analysis for Informed Business Predictions
In the ever-evolving landscape of business, making informed predictions is crucial for strategic decision-making. One effective tip to achieve this is by utilizing statistical analysis to identify correlations between different variables and leveraging those correlations to make accurate predictions. This approach empowers businesses to gain valuable insights into their operations, customers, and market trends.
Statistical analysis involves examining data sets to uncover patterns and relationships between variables. By applying various statistical techniques such as correlation analysis, businesses can identify the strength and direction of relationships between different factors. For instance, they can determine if there is a positive correlation between advertising expenditure and sales revenue or if there is a negative correlation between customer satisfaction ratings and product returns.
Identifying these correlations provides businesses with the opportunity to make informed predictions about future outcomes. For example, based on historical data, they can predict how changes in advertising expenditure might impact sales revenue. By understanding the relationship between customer satisfaction ratings and product returns, they can forecast potential returns based on customer feedback.
The key advantage of utilizing statistical analysis for predictive purposes lies in its ability to provide objective evidence rather than relying solely on intuition or guesswork. Statistical techniques enable businesses to quantify relationships between variables and assess their significance. This helps in making more accurate predictions compared to subjective judgment alone.
Moreover, statistical analysis allows businesses to identify hidden patterns or trends that may not be immediately apparent. By analyzing large datasets spanning various dimensions such as time periods or customer segments, businesses can uncover valuable insights that drive better decision-making. These insights may include identifying seasonal patterns in sales, understanding customer preferences across different demographics, or recognizing factors that influence employee productivity.
However, it’s important to note that while statistical analysis provides valuable information, it should be complemented with domain knowledge and contextual understanding. Businesses must interpret the results within the framework of their industry dynamics and consider other relevant factors that may impact predictions.
In conclusion, utilizing statistical analysis to identify correlations between different variables is a powerful tool for making informed predictions in business decision-making. By leveraging objective evidence, businesses can gain valuable insights into their operations and make accurate forecasts about future outcomes. This approach enhances strategic planning, resource allocation, and overall performance. Embracing statistical analysis as part of the decision-making process empowers businesses to navigate uncertainties with confidence and stay ahead in today’s competitive landscape.
Utilize quantitative techniques such as regression analysis, Monte Carlo simulation, and optimization algorithms to identify optimal solutions for complex problems with multiple variables.
Utilizing Quantitative Techniques for Optimal Business Solutions
In the world of business, making decisions that yield optimal outcomes is a constant challenge. Fortunately, quantitative techniques provide a powerful arsenal of tools to tackle complex problems with multiple variables. By leveraging techniques such as regression analysis, Monte Carlo simulation, and optimization algorithms, businesses can identify optimal solutions and make informed decisions.
Regression analysis is a statistical technique that helps businesses understand the relationship between variables. By analyzing historical data, regression models can identify patterns and correlations, allowing businesses to make predictions and estimate the impact of changes in one variable on others. This technique is particularly useful when dealing with large datasets and numerous variables.
Monte Carlo simulation takes decision-making a step further by introducing randomness into the equation. By generating multiple iterations of a model using random variables, this technique provides insights into the range of possible outcomes for different decision scenarios. Monte Carlo simulation allows businesses to assess risks and uncertainties associated with their choices, helping them make more robust decisions.
Optimization algorithms offer yet another powerful tool for decision-making. These algorithms help identify the best possible solution within given constraints or objectives. Whether it’s maximizing profits, minimizing costs, or optimizing resource allocation, optimization algorithms use mathematical models to find the most efficient course of action.
By utilizing these quantitative techniques in combination, businesses can gain a deeper understanding of complex problems and uncover optimal solutions. For example, regression analysis can provide insights into relationships between variables; Monte Carlo simulation can assess uncertainties associated with those relationships; and optimization algorithms can identify the best possible outcome based on predefined objectives.
The benefits of utilizing quantitative techniques are evident across various industries. For instance, in supply chain management, these techniques can optimize inventory levels by considering demand patterns and cost factors simultaneously. In financial planning and investment analysis, they can help forecast market trends and evaluate risk-return trade-offs accurately.
However, it’s important to note that while quantitative techniques are powerful tools for decision-making, they should be used judiciously. The results obtained from these techniques should always be interpreted in the context of the specific business problem and supplemented with qualitative analysis and expert judgment.
In conclusion, businesses can greatly benefit from employing quantitative techniques such as regression analysis, Monte Carlo simulation, and optimization algorithms. These tools enable them to navigate complex problems with multiple variables and identify optimal solutions. By leveraging data-driven insights, businesses can make informed decisions that lead to improved performance, increased efficiency, and a competitive edge in today’s dynamic business landscape.
Leverage predictive analytics tools such as machine learning algorithms to identify patterns in historical data and create forecasts that can inform future decisions.
Leveraging Predictive Analytics: Unleashing the Power of Machine Learning in Business Decision-Making
In the era of big data, businesses have access to an abundance of information that can be harnessed to gain valuable insights and make informed decisions. One powerful technique that has gained traction in recent years is predictive analytics, powered by machine learning algorithms. By utilizing these tools, businesses can uncover hidden patterns within historical data and generate accurate forecasts that inform future decisions.
Predictive analytics involves analyzing past data to identify trends, patterns, and relationships. By employing machine learning algorithms, businesses can go beyond traditional statistical analysis and tap into the power of artificial intelligence to uncover complex patterns that may not be apparent to human analysts. This enables them to make more accurate predictions about future outcomes.
One key advantage of leveraging predictive analytics is its ability to handle large volumes of data quickly and efficiently. Machine learning algorithms are designed to process vast amounts of information in a fraction of the time it would take for humans to analyze manually. This allows businesses to make timely decisions based on real-time or near real-time data.
By identifying patterns in historical data, predictive analytics enables businesses to create forecasts that inform future decisions across various domains. For instance, sales forecasting can help optimize inventory levels and production planning, ensuring that businesses meet customer demand while minimizing costs. Customer behavior analysis can aid in targeted marketing campaigns and personalized recommendations, enhancing customer satisfaction and loyalty.
Moreover, predictive analytics can assist in risk management by identifying potential risks before they occur. By analyzing historical data on accidents, frauds, or security breaches, businesses can proactively implement preventive measures and mitigate potential threats.
It’s important to note that while predictive analytics offers immense potential for improving decision-making processes, successful implementation requires careful consideration. Businesses must ensure they have high-quality data available for analysis and understand the limitations and assumptions associated with machine learning models.
Additionally, human expertise remains essential in interpreting results generated by predictive analytics tools. Machine learning algorithms are powerful tools, but they still require human judgment to validate and contextualize the insights they provide. Combining the analytical capabilities of machine learning with human intuition and domain knowledge creates a synergy that leads to more effective decision-making.
In conclusion, leveraging predictive analytics tools, such as machine learning algorithms, empowers businesses to unlock the hidden potential within their data. By identifying patterns in historical data and generating accurate forecasts, businesses can make informed decisions that drive growth, optimize operations, and mitigate risks. Embracing the power of predictive analytics enables businesses to stay ahead in a rapidly evolving business landscape where data-driven decision-making is key to success.
Use decision trees or other decision support systems to evaluate different scenarios and outcomes when making decisions about investments or other business operations with high risk/reward ratios.
Using Decision Trees: A Powerful Tool for Evaluating Risk and Reward in Business Decisions
When it comes to making decisions about investments or other business operations with high risk/reward ratios, it’s crucial to have a systematic approach that considers all possible scenarios and outcomes. This is where decision trees and other decision support systems come into play.
Decision trees are graphical representations that allow businesses to evaluate different alternatives, their associated probabilities, and potential outcomes. They provide a visual framework for analyzing choices and assessing the risks and rewards associated with each option.
One of the key advantages of using decision trees is their ability to handle complex decision-making situations. By breaking down a decision into smaller components, businesses can systematically evaluate the potential consequences of each choice. This helps in identifying the most favorable path forward while considering uncertainties and trade-offs.
When evaluating investments or high-risk business operations, decision trees enable businesses to consider multiple factors such as market conditions, competition, regulatory changes, financial implications, and more. By assigning probabilities to different outcomes based on historical data or expert judgment, businesses can quantify the risks involved.
Decision trees also facilitate sensitivity analysis by allowing businesses to explore how changes in variables or assumptions impact the overall outcome. This helps in understanding which factors have the most significant influence on the final results and allows for better risk management.
Furthermore, decision support systems built around decision trees provide a structured platform for collaboration among stakeholders involved in the decision-making process. By involving multiple perspectives and expertise, businesses can make more well-rounded decisions that consider various viewpoints.
In summary, using decision trees or other decision support systems is an effective strategy when evaluating investments or high-risk business operations. These tools enable businesses to assess different scenarios and outcomes systematically, considering both risk and reward factors. By visually representing options and their associated probabilities, decision trees provide clarity and facilitate informed choices.
However, it’s important to remember that decision trees are only as good as the data and assumptions used in their construction. It’s crucial to ensure that the inputs are accurate and up-to-date to obtain reliable results. Additionally, decision trees should be used in conjunction with other quantitative techniques and expert judgment to get a comprehensive understanding of the decision at hand.
In conclusion, by utilizing decision trees or other decision support systems, businesses can navigate high-risk situations with greater confidence. These tools help in evaluating different scenarios, quantifying risks, and considering potential rewards. Ultimately, they empower businesses to make well-informed decisions that align with their objectives and maximize their chances of success.
Analyze large datasets using big data technologies like Hadoop or Spark to uncover hidden insights that can help inform strategic decisions about products, pricing, customer segmentation, etc..
Unleashing the Power of Big Data: Analyzing Large Datasets for Strategic Business Decisions
In today’s digital age, businesses are generating and collecting vast amounts of data at an unprecedented rate. However, the true value lies not just in the volume of data but in the insights that can be extracted from it. This is where big data technologies like Hadoop and Spark come into play, revolutionizing the way businesses analyze large datasets and make informed strategic decisions.
Analyzing large datasets using big data technologies offers businesses a unique opportunity to uncover hidden insights that can have a significant impact on various aspects of their operations. Let’s delve into how these technologies can help inform critical decisions related to products, pricing, customer segmentation, and more.
One key advantage of leveraging big data technologies is their ability to handle massive volumes of structured and unstructured data efficiently. Traditional databases often struggle to process such large datasets, leading to slow query times or even system crashes. Hadoop and Spark, on the other hand, are designed to distribute data processing across multiple nodes or clusters, enabling faster analysis and exploration of vast amounts of information.
By harnessing these technologies’ power, businesses can gain deeper insights into customer behavior and preferences. Analyzing large datasets allows for more accurate customer segmentation based on demographics, purchasing patterns, online behavior, or social media interactions. This information enables businesses to tailor their products or services to specific customer segments effectively.
Furthermore, big data analytics can shed light on pricing strategies by uncovering patterns in customer responses to different price points. By analyzing historical sales data along with external factors like market trends or competitor pricing strategies, businesses can optimize their pricing models for maximum profitability while remaining competitive.
Product development is another area where big data analytics plays a vital role. By analyzing large datasets encompassing customer feedback, product usage patterns, or market trends, businesses can identify areas for improvement or new product opportunities. These insights enable companies to make data-driven decisions about product enhancements, innovations, or even entirely new offerings.
Additionally, big data technologies can assist in detecting fraud and enhancing cybersecurity measures. By analyzing vast amounts of transactional data in real-time, businesses can identify anomalies or suspicious patterns that may indicate fraudulent activities. This proactive approach helps safeguard the organization’s financial well-being and protects customer trust.
In conclusion, big data technologies like Hadoop and Spark have transformed the way businesses analyze large datasets to inform strategic decisions. By leveraging these powerful tools, companies can uncover hidden insights that would otherwise remain buried within the vast sea of data. Whether it’s optimizing pricing strategies, refining customer segmentation, driving product innovation, or enhancing security measures, big data analytics has become an indispensable asset for businesses seeking a competitive edge in today’s data-driven world.
Utilize data visualization tools such as Tableau or Power BI to present information clearly and concisely so that stakeholders can easily understand it and make informed decisions quickly
Utilize Data Visualization Tools for Effective Business Decision-Making
In the era of big data, businesses have access to vast amounts of information. However, making sense of this data and transforming it into actionable insights can be a daunting task. This is where data visualization tools like Tableau and Power BI come into play, revolutionizing the way businesses present and analyze information.
Data visualization tools enable businesses to present complex data sets in a visually appealing and intuitive manner. They transform raw data into interactive charts, graphs, dashboards, and infographics that are easy to understand, even for non-technical stakeholders. Let’s explore why utilizing these tools is essential for effective business decision-making.
Clear Communication: One of the main challenges in decision-making is effectively communicating insights to stakeholders. Data visualization tools provide a clear and concise way to present information. Instead of sifting through spreadsheets or lengthy reports, stakeholders can quickly grasp key trends, patterns, and relationships through visually engaging visuals. This enables faster comprehension and more informed decision-making.
Enhanced Understanding: Visual representations have a powerful impact on human cognition. By representing complex data in visual formats such as bar charts, pie charts, heat maps, or interactive maps, data visualization tools make it easier for stakeholders to identify trends and outliers at a glance. The ability to drill down into specific details or filter information further enhances understanding and aids in making informed decisions.
Interactive Exploration: Data visualization tools offer interactivity features that allow users to explore data from different angles or perspectives. Stakeholders can interact with visualizations by filtering variables or adjusting parameters in real-time. This flexibility enables them to ask specific questions about the data and gain deeper insights without relying solely on pre-defined reports or static visuals.
Spotting Opportunities and Risks: With data visualization tools, businesses can identify hidden opportunities or potential risks that may not be apparent in raw data alone. By visualizing correlations or anomalies across various dimensions of their operations, stakeholders can make connections and take proactive measures. This empowers businesses to seize opportunities promptly or mitigate risks before they escalate.
Real-Time Decision-Making: In today’s fast-paced business environment, real-time decision-making is crucial. Data visualization tools can connect to live data sources, allowing stakeholders to monitor key metrics and KPIs in real-time. By visualizing data as it is being generated, businesses can respond swiftly to changing conditions or emerging trends, enabling them to make timely decisions that drive success.
In conclusion, utilizing data visualization tools such as Tableau or Power BI is essential for effective business decision-making. These tools enable businesses to present information clearly and concisely, making it easier for stakeholders to understand complex data sets and make informed decisions quickly. By leveraging the power of visualization, businesses can unlock valuable insights and gain a competitive edge in today’s data-driven world.


Wow, superb blog layout! How long have you ever been running a blog for?
you made running a blog glance easy. The full
look of your website is wonderful, let alone the content material!
You can see similar here najlepszy sklep
Thank you for your positive feedback! We’re glad you enjoyed the blog article on quantitative techniques for business decisions. If you have any questions or would like further information on the topic, feel free to reach out.